


Your October market update for single-family homes in the Dallas-Fort Worth-Arlington Metropolitan Statistical Area. Información en español más abajo.
October 2026: DFW at a glance
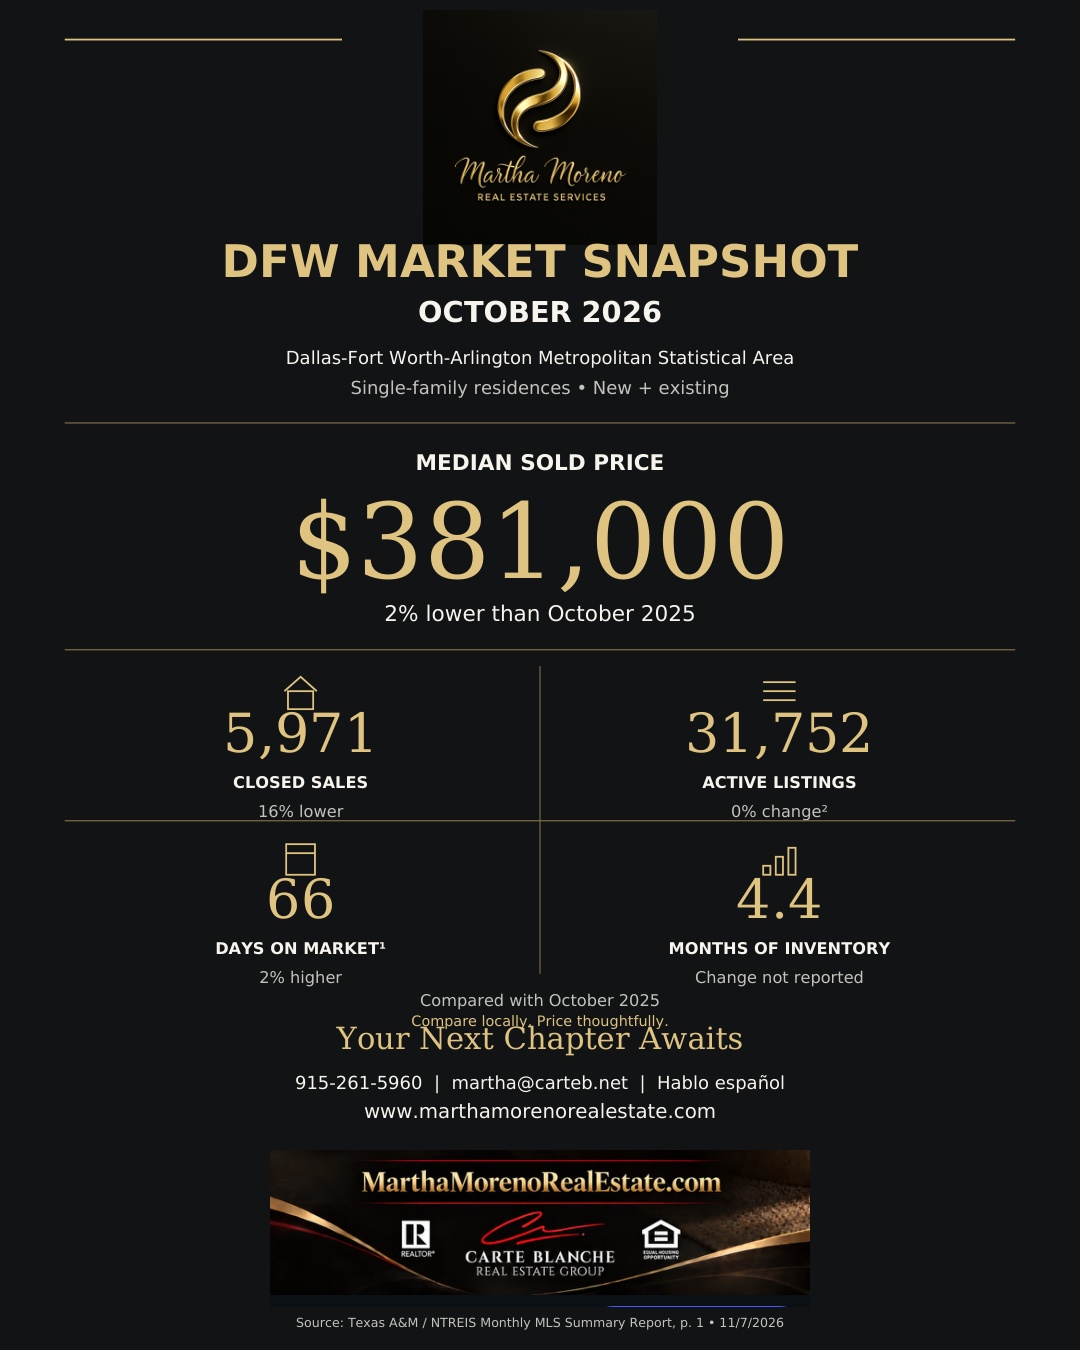
Area: Dallas-Fort Worth-Arlington Metropolitan Statistical Area. Property type: Single-family residences, new and existing, sold through the MLS. Changes compare October 2026 with October 2025.
- Median sold price: $381,000 — 2% lower.
- Closed sales: 5,971 — 16% lower.
- Active listings: 31,752 — reported change of 0%, rounded.
- Days on market: 66 — 2% higher. The source labels this measure “DOM” without specifying average or median.
- Months of inventory: 4.4 — comparison not reported.
- Median sold price per square foot: $182.39 — 2% lower.
What this means for your next chapter
Sales and the median sold price were lower than a year earlier, while active listings were essentially unchanged at the report’s rounded precision. Your neighborhood, price range and property condition still matter.
Buying? Compare similar homes, their condition and time on market before making an offer. Selling? Use recent comparable sales and current competing listings to set your price. Regional statistics do not determine an individual home’s value.
Fort Worth and Tarrant County — separate local figures
Same October NTREIS report; single-family residences, new and existing. These are different geographic areas; their figures are not added to the regional totals.
- Fort Worth city: $319,000 median sold price; 701 sales; 3,247 active listings; 56 reported days on market; 3.9 months of inventory (page 59).
- Tarrant County: $343,990 median sold price, 1% lower than October 2025; 1,460 sales, 15% lower; 56 reported days on market; 3.6 months of inventory (page 27). Active listings and other annual changes are not supplied in that county table.
Mercado de vivienda DFW — octubre de 2026
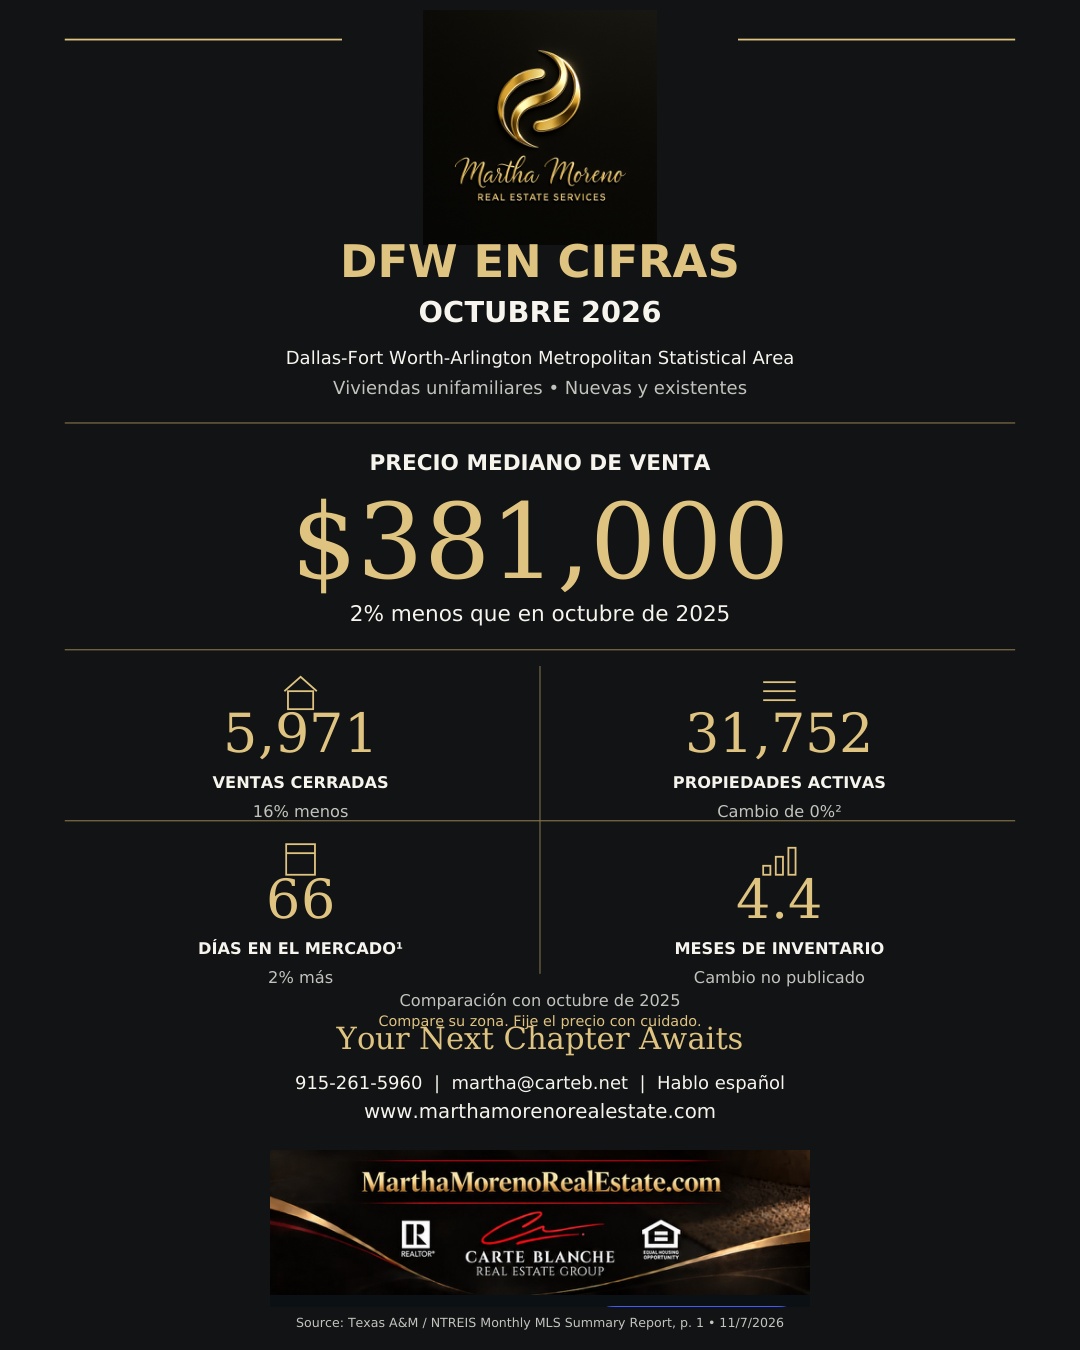
Zona: Área Estadística Metropolitana de Dallas-Fort Worth-Arlington. Tipo de propiedad: Viviendas unifamiliares nuevas y existentes vendidas a través del MLS. Los cambios comparan octubre de 2026 con octubre de 2025.
- Precio mediano de venta: $381,000 — 2% menos.
- Ventas cerradas: 5,971 — 16% menos.
- Propiedades activas: 31,752 — cambio publicado de 0%, redondeado.
- Días en el mercado: 66 — 2% más. La fuente usa “DOM” sin especificar si es promedio o mediana.
- Meses de inventario: 4.4 — comparación no publicada.
- Precio mediano de venta por pie cuadrado: $182.39 — 2% menos.
Su próximo capítulo
Las ventas y el precio mediano fueron menores que un año antes. Las propiedades activas casi no cambiaron según la precisión redondeada del informe. Su vecindario, rango de precio y el estado de la vivienda siguen siendo importantes.
¿Compra? Compare viviendas similares, su estado y tiempo en el mercado antes de hacer una oferta. ¿Vende? Use ventas comparables recientes y propiedades que compiten con la suya para fijar el precio. Los datos regionales no determinan el valor de una vivienda.
Fort Worth y el condado de Tarrant — datos locales separados
Mismo informe de octubre; viviendas unifamiliares nuevas y existentes. Son zonas diferentes; sus cifras no se suman al total regional.
- Ciudad de Fort Worth: Precio mediano de $319,000; 701 ventas; 3,247 propiedades activas; 56 días reportados en el mercado; 3.9 meses de inventario (página 59).
- Condado de Tarrant: Precio mediano de $343,990, 1% menos que en octubre de 2025; 1,460 ventas, 15% menos; 56 días reportados en el mercado; 3.6 meses de inventario (página 27). La tabla del condado no incluye propiedades activas ni otros cambios anuales.
Sources / Fuentes
October 2026 NTREIS Monthly MLS Summary Report, prepared by the Texas Real Estate Research Center at Texas A&M University, using North Texas Real Estate Information System/Data Relevance Project data; publicly hosted by MetroTex. Report data date: November 7, 2026. DFW page 1; Tarrant County page 27; Fort Worth page 59. MetroTex report library.
Current-month sales are projected counts and may be revised. Annual percentages retain the source’s rounded precision. Inventory comparison is not reported. The source does not specify average versus median for “DOM.” This post uses public reports, not private NTREIS access. Separate GFWAR and Texas REALTORS® MarketViewer series are not combined with these figures.
Las ventas del mes son cifras proyectadas y pueden revisarse. Los porcentajes anuales conservan el redondeo de la fuente. No se publica una comparación del inventario. La fuente no especifica promedio o mediana para “DOM”. Se usan informes públicos, sin acceso privado a NTREIS. No se mezclan las series separadas de GFWAR o Texas REALTORS® MarketViewer.
Your Next Chapter Awaits
Martha Moreno • Carte Blanche Real Estate Group
Hablo español
915-261-5960 | martha@carteb.net
www.marthamorenorealestate.com